Posts

Lab 11: Introduction to using an UAS

Image
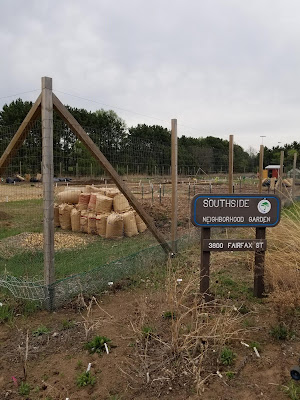
Introduction to using an UAS This lab was an introduction to using unmanned aerial systems. This blog is pictures from this day.  Figure 1. The location of the lab. Community garden south of Southern Middle School in Eau Claire, WI. Figure 2. Professor Joseph Hupy prepping the UAS for flight. Figure 3. First take off of the day. Figure 4. The Master controller for the UAS.  Figure 5. Geology major, Betty Walter, taking a look at the Master controller. 

Lab 10: Distance Azimuth Survey Method

Image
Distance Azimuth Survey Method Introduction             Technology within the Geospatial field has exploded within the past few decades. This technology can make surveying today very efficient and accurate, but sometimes technology fails. Therefore, it is important to have an alternative method that doesn’t need modern technology. This lab was used to learn the method of distance azimuth. This method uses a GPS unit and a laser distance finder to perform a survey.             This labs goal was to collect some data on various tree species on Putnam Drive on the University of Wisconsin- Eau Claire Campus (Figure 1). Putnam Drive is a nature trail that runs east-west on the southern part of UW- Eau Claire’s lower campus. Eau Claire was a lumber town, so many of the forests that are present today have been replanted. Part of Putnam Drive was never harvested during this time and therefore, Putnam Drive has some of the oldest trees in Eau Claire along its path. This path is also

Lab 9: Arc Collector Part II - Assessment of Water Street and Chippewa Street, Eau Claire, WI for Rollerblading

Image
Arc Collector Part II: Assessment of Water Street and Chippewa Street, Eau Claire, WI for Rollerblading Introduction Rollerblading is a great way to get outdoors and get exercise within a city, but badly maintained sidewalks can make rollerblading an hazardous experience. Rollerblading is common within college students and Eau Claire is a college town; therefore, the assessment of two major streets for rollerblading hazards was done to try to quantify the hazards in the college portion of Eau Claire. ArcCollector was used to collect data for this study. The various attributes used to assess the hazards of various sidewalks were the number of rocks/Twigs, the amount of sediment present, and the number of cracks/bumps. When walking the study area, a point was taken when one of these hazards was encountered. Methodology The first thing that needed to be done to complete this study was to created a geodatabase within ArcGIS. A file geodatabase was created and named appropriately. T

Lab 8: Arc Collector - An Introduction to Gathering Geospatial Data on a Mobile Device, such as a Tablet or Smartphone

Image
Arc Collector: An Introduction to Gathering Geospatial Data on a Mobile Device, such as a Tablet or Smartphone Introduction             This lab used the app Arc Collector to measure the micro climate of various points around the University of Wisconsin- Eau Claire campus. The purpose of the lab was to give students an introduction in the use of Arc Collector and the many types of research that it can be used for. In this project, students were separated into seven groups and each group took a various section of campus. The students then used a handheld micro climate device and compass to measure the wind speed, wind direction, temperature at the surface, temperature 2 meters above the ground, dew point, and type of surface. All of the information was collected using Arc Collector and then mapped used ArcMap. Study Area             The study area consisted of the University of Wisconsin- Eau Claire campus, located in Eau Claire, Wisconsin. The campus was split into seven

Lab 7: Using Survey 123 to Gather Survey Data using your Smart Phone

Image
Using Survey 123 to gather survey data using your smart phone Introduction             This lab was a tutorial from Learn ArcGIS Online, called “Get Started with Survey 123 for ArcGIS” (Figure 1). This tutorial walks students through the process of creating a survey, as well as, the viewing the survey data collected and the analysis of the data. Figure 1. An image of the tutorial taken on Learn ArcGIS Online.              Survey 123 stresses that it is a field data collection system that makes accurate field data collection easy. The survey can be created online and then the app can be downloaded on Android or Apple devices and surveys can be taken from the app. Therefore, making data collection in the field much easier, while still being accurate. The data can also be analyzed in the field for quick decision making in the field. Methodology             The first step is to go to the survey 123 website and log on. Once this is done, the “create a new sur

Lab 6: Using a Bluetooth GPS with an iOS Device

Image
Lab 6: Using a Bluetooth GPS with an iOS Device Introduction This lab used the BadElf GPS app with a Bluetooth GPS device to track the group’s movement as we conducted a basic find and seek on the UW- Eau Claire campus (Figure 1). Bluetooth connect devices, such as BadElf, are becoming increasingly popular. As smartphones became increasingly accurate with internal GPS, it became more cost efficient and convenient to have a GPS device attached to one’s smartphone instead of large pieces of equipment. Today, smartphones and tablets are used in a wide variety of geoscientist fields because it is more efficient and more cost effective. Figure 1. This is map of the location of the UW- Eau Claire campus within Eau Claire County, Wisconsin.  There is a variety of app that can be used on a smartphone that are compatible with BadElf. One of these apps is Collector for ArcGIS. This app allows one to collect and update data using the map or GPS and download maps to wor

Lab 5: Construction of a Point Cloud Data Set, True Orthomosaic, and Digital Surface Model using Pix4D Software

Image
Introduction          Pix4D is a premier software for the construction of point clouds. This program is user friendly and has a lot of intriguing features. This lab will consist of the use of Pix4D to process a set of unmanned aerial system (UAS) data points taken from South Middle School in Eau Claire, Wisconsin. This study area consists of the South Middle School garden (Figure 1). This lab is designed to accurately process the data set using Pix4D. Figure 1. This map contains the city of Eau Claire, which is located in Eau Claire County, Wisconsin. The South  Middle school garden is the location of the red box in the south-east portion of the map.  To produce highly accuracy results, a high overlap between images is needed. Since, Pix4D uses similarities between images to match up locations, flat terrain with similar vegetation, such as agricultural fields can be difficult to analyze. It is suggest to increase the overlap to at least 85% frontal and 70% side for thi