Lab 4: Introduction to Pix4D
Introduction to Pix4D
Introduction
A premium
software for analyzing unmanned aerial system (UAS) data is Pix4D. Pix4D
creates images by using thousands of common points between images. This
software uses matching keypoints to create 3D points. Matching keypoints are
two points located on different images that are the same. In this introduction
lab, the UAS data was already proceeded by Dr. Joseph Hupy. The data structure
of processed UAS data in Pix4D is exported in the same structure. Four folders
and a text document will be created (Figure 1). The files will be 1_initial,
2_densification, 3_dsm_ortho, and temp. These files contained all of the
outputs needed to complete the following introduction lab.
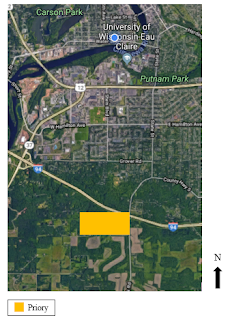
In this
lab, the UAS dataset was of a mine site in Eau Claire, Wisconsin. The main task
of Pix4D was to assess the stockpiles present on site. A very important aspect
used in this dataset was the volume calculator. The animation tool was also able
to be used to create a good visual of the mine site. ArcMap and ArcScene were
also used in this lab to create maps of the mine site.
 |
| Figure 1. This image is all of the file outputs that are created after processing a dataset in Pix4D. |
Methodology
The navigation of a project in
Pix4D is a little different than other geographic programs. Left clicking on
the mouse allows one to pan throughout the displayed image. The scroll on the mouse
allows one to zoom in and out. If the left and right button the mouse are held
down the image will rotate in 3D. The image UAS data points, labeled cameras in
Pix4D, and the tie points are very accessible to view in this software (Figure
2). In Pix4D triangle meshes will need to be created in order to turn the data
points into a more concrete image. This is done by simply clicking on rayCloud
from the left hand tool bar and checking the Triangle Meshes section. This will
take a few minutes to load but will then display a more complete image (Figure
3).
 |
| Figure 2. This image shows the UAS collected data points as red circles and the GCP's taken in blue X's. |
 |
| Figure 3. This image was taken after the triangle meshes were computed to create a more complete image on Pix4D. |
The ability to calculate the volume
of a stockpile is a very important aspect of Pix4D. To start this process,
click on the volumes tab on the left hand side of the screen. Here, there is a
small cylinder with a plus symbol that can be selected. Once the volume
cylinder is clicked, one can simply outline the outside of the item of
interest. The scroll on the mouse can be used to zoom in and increase
precision. Once the item is outlined, the right mouse bottom is used to finish
the polygon. The compute button can then be pressed to calculate the volume.
Pix4D will compute 4 values: terrain 3D area, cut volume, fill volume, and
total volume (Figure 4).
 |
| Figure 4. This image was taken after the calculation of the volume of a stockpile. The stockpile that was calculated is shown to the right and the values calculated are shown in the left hand column. |
Animations can also be done in
Pix4D. To create an animation video adjust the view on the screen to a region
of interest. Then, the video camera button can be selected within the rayCloud
tab. The user recorded views button should be used and then the next button
hit. Now, a series of short left clicks and drags should be done to create the
video. After each click and drag the button, “record trajectory waypoint”
should be selected. After, an area has been covered that was of interest the
next button can be selected again. An appropriate time for the video can then
be selected, in this lab a 20 second video was used. To view the video the play
button can be selected from the right hand side of the screen. Once, a decent
view is create the render button, also on the right side, is used to save the
video. For new users, this may take some time to create a decent video clip.
The final step in the analyzing of
this UAS dataset was the use of ArcMap and ArcScene to create a nice display of
the data points. The digital surface model (DSM) imagery was first imported
into ArcMap. Then a hillshade was created to give the ArcMap image depth. The
DSM was then given an appropriate color ramp and a transparency of 40% and
overlaid the hillshade file to give the mine site a good depth. The DSM was
also imported into ArcScene to create a more cross-sectional view of the
stockpiles. Two different images were created and imported into ArcMap. A
cartographically pleasing map was then able to be created.
Results
The UAS data
used in this lab was not processed in this lab; it was done by the professor.
The features that are used to analyze the data after processing are very
helpful in assessing a study area. The volume feature on this software, if data
is accurate, makes the calculation of economic sand or aggregate piles much
more precise with much less time input, making it very cost efficient. Within
the volume calculation shown in Figure 4 above, a total stockpile volume of
1112.37 ± 15.14 m3
was calculated (Figure 5).
 |
Figure 5. This figure shows the stockpile with the volume of 1112.37 ± 15.14 cubic meters.
This is the same stockpile as in Figure 4, but from another angle.
|
The animation option on Pix4D is
very helpful for business development and advertising. Although, the video
capturing takes a bit to get used to, it can produce quality video with
relatively little time input. In the use at a mine site, it could be used on a
company website or to impress potential business investors (Figure 6). The
importation of this UAS dataset to ArcMap always nice maps to be created.
ArcScene was also used to create 2D images of the 3D data in order to get a
cross-sectional look at the stockpiles of the study area. A final map can be
created in ArcMap to display the mine site from various perspectives (Figure
7).
Figure 6. This is the animation that was created of the mine site in Eau Claire, Wisconsin.
 |
| Figure 7. The final map created of the mine site using ArcMap and ArcScene. |
Conclusion
Overall,
Pix4D was a very user-friendly program for the analyzes of UAS data. The
navigation is a little bit different than other geographic software’s, but with
some practice it is efficient and very useful. The volume calculation tool can
also be done in ArcMap, but it is nice to have an option with various
software’s. The animation feature is what is most unique. The ability of Pix4D
to create high quality videos with relatively minimal effort is a very
important aspect of the software. Only a few tools were assessed in this lab, a
much longer use of Pix4D is necessary to come to a more comprehensive critique
of the program.
References
Data
collected and initially processed by Joseph Hupy.


Comments
Post a Comment